Shadcn Charts and Graphs
Explore a collection of responsive and customizable Shadcn charts and graphs, perfect for creating stunning data visualizations in your web projects.
Explore Charts & Graphs


26+ Shadcn Charts & Graphs
Submit Resource
Glass UI
Glassmorphic components inspired by Apple’s modern design.

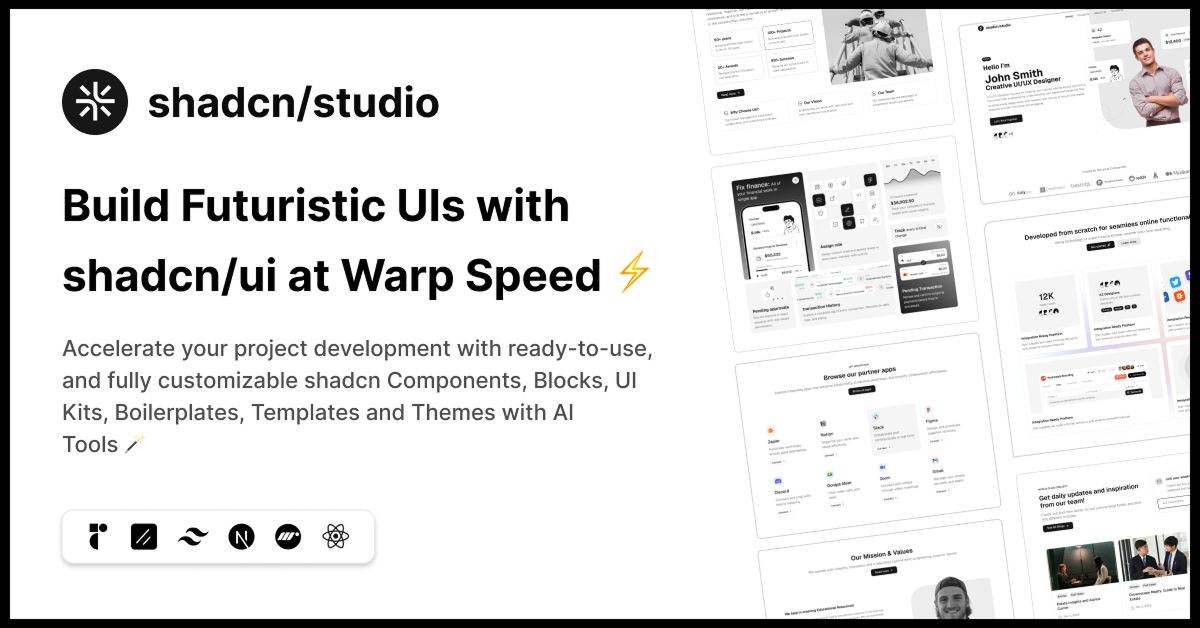
shadcn/studio
Open-source Shadcn registry with copy-paste components.


ScrollX UI – Interactive React Components for Modern UIs
Create stunning interfaces with handcrafted components.

21st.dev
Explore, copy, and remix thousands of high-quality React components

Shadcraft Starter Kit
Complete shadcn/ui toolkit with pixel-perfect UI, theming, and blocks.

Blitz Charts: Interactive Charts for shadcn/ui
Beautiful Animated Charts for shadcn/ui ecosystem

Roi UI - Component system with CSS Modules
A UI library designed to keep you in the flow

Tremor – Copy-and-Paste Components
Open-source, accessible React UI components styled with Tailwind CSS.


Linked Chart & Table Component
React component that synchronizes chart views, built with shadcn/ui.

Graphitup Charts
Create free downloadable Shadcn-themed charts, graphs, & images.

Sysinfocus simple/ui
A Fresh Take on Building Beautiful UI Components.

Crypto Charts Pi
A Visual and Interactive Way to Track Cryptocurrency Trends.

Rust shadcn/ui
Beautifully designed components that you can copy and paste.

Shadcn Svelte Extras
Turn key shadcn-svelte components to help finish your app.
.png?width=600&height=314&format=auto)

Components work: Components for React
Collection of components for Nextjs built using Tailwind and shadcnui.

Magic UI
Free and open-source animated components built with React.

Launch UI
Carefully crafted components and templates built with Shadcn/ui.

Extend UI
Beautifully designed landing page components built with Shadcn/UI.
Awesome Collection of Shadcn UI Charts & Graphs
Data visualization is a cornerstone of modern web applications, providing users with intuitive insights into complex datasets. With the introduction of the Shadcn Charts & Shadcn Graphs component, developers now have access to a powerful, customizable, and accessible charting solution built on top of Recharts. This guide delves into the features, installation, and best practices for integrating Shadcn Charts into your React applications.
What Are Shadcn Charts & Shadcn Graphs?
Shadcn Charts is a collection of Shadcn components that consist of Charts and Graphs designed to seamlessly integrate with Shadcn UI. Built using Recharts, a popular charting library for React, Shadcn Charts offers a set of composable components that allow developers to create interactive and responsive charts with ease.
Key Features:
Composable: Built on Recharts, supports multiple chart types (bar, line, pie, etc.).
Responsive: Adjusts to screen sizes with
ResponsiveContainer.Tailwind CSS: Easy styling with utility classes.
Accessible: Keyboard and screen reader friendly.
Interactive: Customizable tooltips.
Performance: Optimized for large datasets.
Dynamic: Real-time data updates and binding.
Available Chart Types
Shadcn Charts supports various chart types, including:
Area Chart: Ideal for showing cumulative data over time.
Bar Chart: Useful for comparing quantities across different categories.
Line Chart: Best for displaying trends over periods.
Pie Chart: Great for showing proportions of a whole.
Radar Chart: Suitable for displaying multivariate data.
Radial Chart: Useful for showing data in a circular layout.
Each chart type is designed to be easily customizable and integrates seamlessly with other Shadcn UI components.
Best Practices:
To make the most out of Shadcn Charts & Graphs:
Responsiveness: Use
ResponsiveContainerfrom Recharts to ensure your charts adapt to different screen sizes.Accessibility: Enable the
accessibilityLayerprop to add keyboard and screen reader support to your charts.Styling: Leverage Tailwind CSS classes to style chart elements and ensure they align with your application's design system.
Tooltips: Customize tooltips using
ChartTooltipandChartTooltipContentto provide users with meaningful information.
Conclusion
Shadcn Charts offers a robust solution for integrating interactive and accessible charts into your React applications. By combining the power of Recharts with the flexibility of Shadcn UI, developers can create visually appealing and user-friendly data visualizations. Whether you're building dashboards, analytics tools, or reporting interfaces, Shadcn Charts provides the components you need to present data effectively.
Frequently Asked Questions
Explore frequently asked questions about Charts & Graphs
UI components for building customizable, accessible charts in React apps.
Yes, for easy customization and consistent design.
Have a product?
Submit your Shadcn product to AllShadcn, get featured, and drive genuine traffic while showcasing your work to the world. Turn your creativity into revenue and begin selling today! 🚀