Details about Linked Chart & Table Component
Interactive Data Visualization: Create interactive charts with linked data that users can explore.
Seamless Integration: Easily integrate with various data sources and web technologies.
Customizable and Responsive: Tailor the charts to match your project's style and ensure they look great on all devices.
Real-time Data Updates: Supports dynamic updates and interactions, providing real-time insights.
User-Friendly Interface: Designed for both developers and non-technical users to create and share visual data insights.
#What is Linked Chart?
Linked Chart is a dynamic data visualization library that allows developers to create interactive charts where different datasets can be visually linked, providing deeper insights into relationships and trends. Whether you're building dashboards, reports, or any data-driven web application, Linked Chart makes it easy to visualize complex data through customizable charts that users can interact with.
With its real-time data support and the ability to link various data points across different charts, Linked Chart empowers users to explore the data in-depth, making it a powerful tool for businesses and developers who need sophisticated, interactive data visualizations.
#Features ⚡️
Interactive and Linked Charts: Create charts that are dynamically linked, where interaction with one chart updates others, allowing for better data exploration and understanding.
Real-Time Data Integration: Linked Chart supports live updates, which is perfect for applications requiring real-time data like stock trackers, social media analytics, or live dashboards.
Customizable Designs: Easily adjust the appearance of the charts, from colors and fonts to data labels, to ensure your visualizations align with your branding or project’s aesthetic.
Cross-Platform Compatibility: Fully responsive charts that adapt well to different screen sizes, whether you're building a desktop web application or a mobile-friendly dashboard.
Data Filtering and Interaction: Users can filter data directly within the charts, enabling them to focus on specific data points or trends.
Multiple Chart Types: Supports various types of charts including bar, line, pie, scatter, and more, so you can choose the most effective visualization for your data.
Easy Integration: Designed to integrate smoothly with your existing web applications and backend services, so you can use it with frameworks like React, Vue, or Angular.
#Pros and Cons
#Pros ✅
Enhanced Data Interactivity: The ability to link multiple charts creates a more interactive and engaging user experience.
Real-Time Updates: Supports real-time data, making it suitable for use cases that require up-to-date information.
Ease of Customization: Provides flexible customization options, allowing developers to style the charts to fit their application’s needs.
User-Friendly: The intuitive interface makes it easy for users to interact with and understand the visualized data.
Scalable: Suitable for both small projects and large-scale enterprise applications.
#Cons ⚠️
Learning Curve: Although it’s developer-friendly, integrating complex features or large datasets might require a bit of time to master.
Performance Considerations: Real-time data handling may impact performance with very large datasets or complex visualizations, requiring optimizations for smoother user experience.
Limited Out-of-the-Box Features: Some advanced features (like multi-dimensional data visualization) might require additional customization or coding.
#Included Components - Templates
Linked Chart comes with several pre-designed components to make data visualization easier:
Linked Bar Charts: Display grouped data across multiple categories where interaction with one category reflects updates on the others.
Pie and Donut Charts: Visualize proportions of a whole in an interactive and engaging way.
Line Charts: Perfect for visualizing trends over time, with interactive data points that users can hover over for more information.
Scatter Plots: Used to visualize correlations or clusters between two variables.
Heatmaps: Represent data intensity with color-coded cells, ideal for visualizing large amounts of data across grids.
Tables with Linked Data: Display data tables alongside charts to provide more granular data details while maintaining an interactive experience.
#Pricing 💵
Linked Chart is open-source and free to use. The library is available for developers to use, modify, and integrate into their applications without any licensing fees. However, depending on your project needs (e.g., hosting, advanced features, or third-party integrations), additional costs may apply.
#Integrations 🧰
Linked Chart can be easily integrated with various backend services and technologies, including:
REST APIs: Fetch data from REST APIs and bind it to the charts for dynamic, real-time updates.
Databases: Easily connect to databases like MySQL, PostgreSQL, and MongoDB to pull data for your visualizations.
Cloud Services: Integrate with cloud platforms such as AWS, Google Cloud, or Firebase for scalable data management.
Frontend Frameworks: Works seamlessly with front-end libraries and frameworks like React, Vue, and Angular for building modern web applications.
Frequently Asked Questions
What is Linked Chart?
Linked Chart is a JavaScript library for creating interactive, linked data visualizations, where changes to one chart can automatically update others, helping users to explore and analyze relationships between data points.
Is Linked Chart free to use?
Yes, Linked Chart is an open-source library and free to use. You can integrate it into any personal or commercial project without licensing fees.
Can I integrate Linked Chart with real-time data?
Yes, Linked Chart supports real-time data updates, making it suitable for applications like dashboards, live data feeds, or social media analytics.
What types of charts does Linked Chart support?
Linked Chart supports a variety of charts, including bar charts, line charts, pie charts, scatter plots, heatmaps, and more, with customizable features for each chart type.
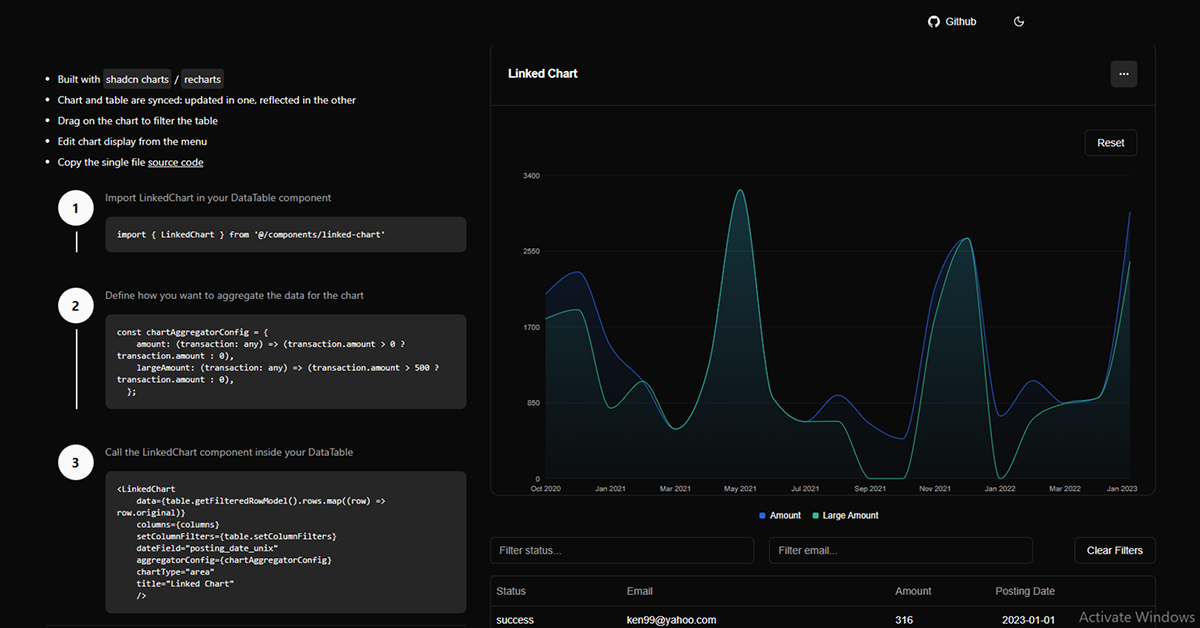
Linked Chart & Table Component
React component that synchronizes chart views, built with shadcn/ui.
Resource Types:
UI Kits :
Shadcn UITechnology Stack :


Have a product?
Submit your Shadcn product to AllShadcn, get featured, and drive genuine traffic while showcasing your work to the world. Turn your creativity into revenue and begin selling today! 🚀