Details about Zoomable Shadcn Chart
Free, open-source zoomable chart demo
Built with Next.js, shadcn/ui, Chart.js, and Tailwind CSS
Features interactive zooming via click-and-drag
Supports responsive design and accessible UI
Community-driven, likely hosted on GitHub
#What is Zoomable Shadcn Chart?
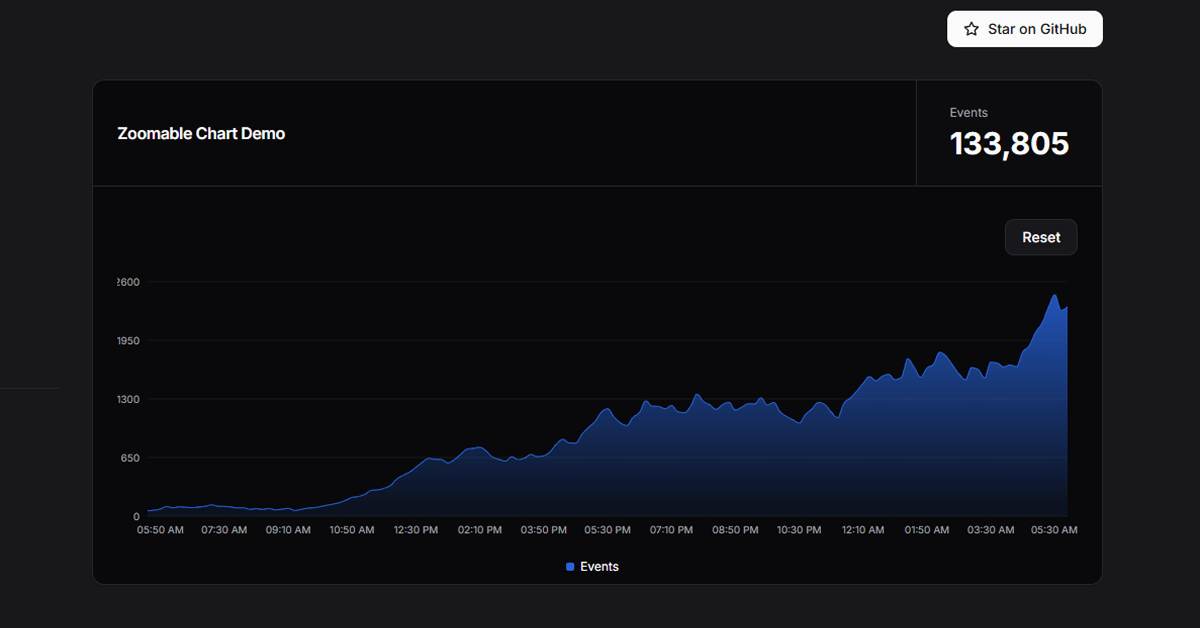
Zoomable Shadcn Chart is a free, open-source demo project showcasing an interactive, zoomable chart built with shadcn/ui components. Its primary goal is to demonstrate how to implement zoomable data visualizations in web applications, targeting developers building dashboards, analytics tools, or data-driven apps. Likely built with Next.js, shadcn/ui, Chart.js, and Tailwind CSS, it uses a zoom plugin (e.g., chartjs-plugin-zoom) to enable click-and-drag zooming on the chart. The demo emphasizes accessibility and simplicity, leveraging shadcn/ui’s Radix UI-based components for a modern, user-friendly interface. For shadcn/ui enthusiasts, Zoomable Shadcn Chart is a perfect fit, offering a practical example of integrating interactive charts with accessible UI in React projects.
#Features ⚡️
Zoomable Chart: Click-and-drag to zoom into chart data for detailed views.
Shadcn UI Integration: Accessible, Radix UI-based components for UI elements.
Responsive Design: Tailwind CSS ensures chart adaptability across devices.
Interactive Controls: Likely supports panning and reset zoom (inferred from Chart.js plugins).
Chart.js Foundation: Robust charting library for data visualization.
Accessible UI: WAI-ARIA compliance via shadcn/ui for inclusive design.
#Pros and Cons
#✅ Pros
Interactive Visualization: Zooming enhances data exploration for users.
Free and Open-Source: Likely open-source, enabling customization.
Shadcn UI Synergy: Accessible components align with modern UI standards.
Responsive: Tailwind CSS ensures seamless cross-device performance.
Developer-Friendly: Easy integration with Next.js and Chart.js.
Community Potential: Backed by Vercel’s shadcn/ui ecosystem.
#⚠️ Cons
Limited Scope: Demo focuses solely on zoomable charts, not a full library.
Documentation Needs: May lack detailed setup or source code guide.
Learning Curve: Requires familiarity with shadcn/ui, Chart.js, and zoom plugins.
Plugin Dependency: Relies on chartjs-plugin-zoom, adding complexity.
Source Code Access: GitHub repo not explicitly linked, limiting contributions.
Feature Depth: May lack advanced chart types or customization options.
#Included Components - Templates
Zoomable Shadcn Chart provides a variety of chart-related features:
Zoomable Chart: Core component for interactive data visualization.
Chart Container: Responsive wrapper for chart rendering.
UI Controls: Shadcn UI buttons or modals for chart interactions (inferred).
Data Display: Chart.js-powered line, bar, or scatter plots (inferred).
#Pricing 💵
Zoomable Shadcn Chart operates on a Free model:
Free Access: Fully open-source demo, likely under MIT license (aligned with shadcn/ui).
No Pro Version: No premium features or paid tiers indicated.
Additional Costs: Potential Vercel hosting costs for deployment; no direct usage fees.
#Integrations 🧰
Zoomable Shadcn Chart likely integrates with:
Next.js: Core framework for rendering and deployment.
Shadcn UI: Radix UI components styled with Tailwind CSS.
Chart.js: Charting library for data visualization.
chartjs-plugin-zoom: Plugin for zoom and pan functionality.
Tailwind CSS: Utility-first styling for responsive design.
Vercel: Hosting for the demo site and potential deployments.
Frequently Asked Questions
What is Zoomable Shadcn Chart, and how does it work with shadcn/ui?
Zoomable Shadcn Chart is a free demo showcasing a zoomable chart with shadcn/ui for accessible, modern UI components.
Is Zoomable Shadcn Chart free to use?
Yes, likely fully open-source with no restrictions.
Can I use Zoomable Shadcn Chart with other frameworks?
No, it’s tailored for Next.js/React, aligned with shadcn/ui’s ecosystem.
How customizable is Zoomable Shadcn Chart?
Customizable with Tailwind CSS, Chart.js, and open-source code.


Have a product?
Submit your Shadcn product to AllShadcn, get featured, and drive genuine traffic while showcasing your work to the world. Turn your creativity into revenue and begin selling today! 🚀