Details about GlobeGraph
Free, open-source web app for visualizing country data
Built with Next.js, TypeScript, Tailwind CSS, and Chart.js
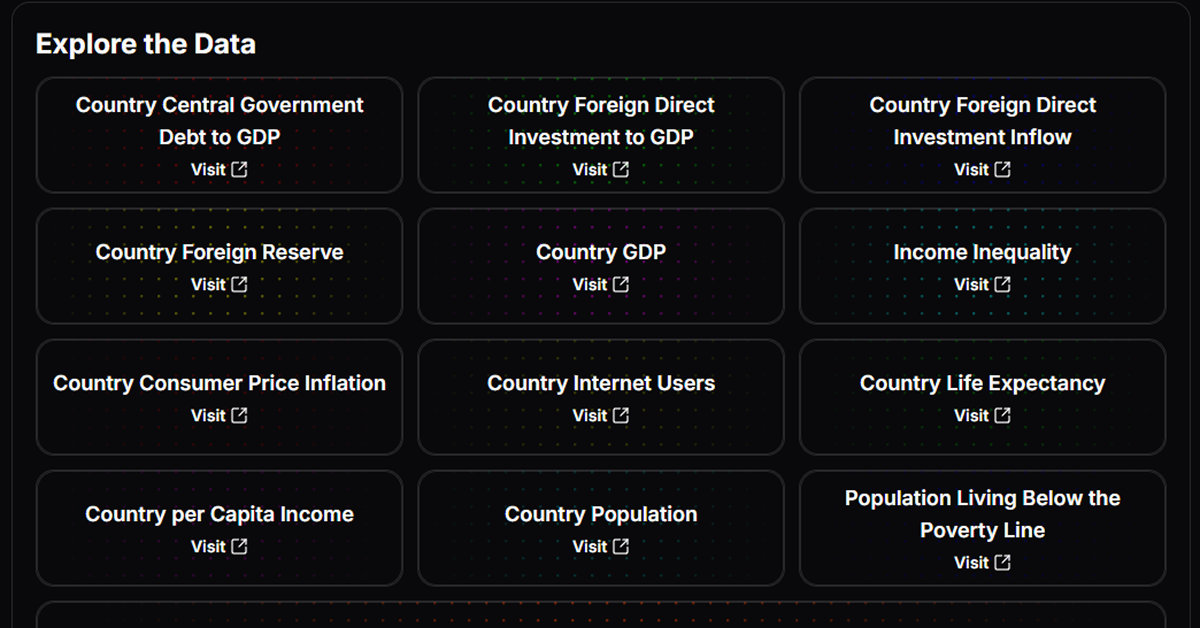
Displays GDP, GDP per capita, and population across years
Features interactive charts and 3D globe with COBE
MIT-licensed, deployable on Vercel
#What is Globe Graph?
Globe Graph is an open-source web application developed by Virous77, designed to visualize country-specific data such as GDP, GDP per capita, and population across different years. Built with Next.js, TypeScript, Tailwind CSS, and Chart.js, it offers interactive charts and a 3D globe powered by COBE for an engaging user experience. Hosted at globe-graph.vercel.app, it targets developers, data enthusiasts, and educators looking to explore economic and demographic trends. The project is MIT-licensed, encouraging contributions via GitHub, and supports easy deployment on Vercel or Docker.
#Features ⚡️
Data Visualization: Displays GDP, GDP per capita, and population with Chart.js-powered graphs.
Interactive 3D Globe: COBE library renders a WebGL-based globe for country selection.
Responsive Design: Tailwind CSS ensures adaptability across devices.
Type Safety: TypeScript for robust, error-free code.
Deployment Options: Supports Vercel hosting and Docker for development/production environments.
Yearly Data Filters: Allows users to view data for specific years.
#Pros and Cons
#Pros ✅
Free and Open-Source: MIT license enables unrestricted use and modification.
Engaging Visuals: 3D globe and interactive charts enhance user experience.
Modern Stack: Next.js, TypeScript, and Tailwind CSS ensure scalability.
Easy Deployment: Vercel and Docker setups streamline hosting.
Community Contributions: Open to enhancements via GitHub.
#Cons ⚠️
React Dependency: Limited to Next.js/React ecosystems.
Data Scope: Focuses on GDP, population, and related metrics, lacking broader datasets.
Learning Curve: Requires familiarity with Next.js and TypeScript for contributions.
Performance Concerns: 3D globe animations may lag on low-end devices.
#Included Components
3D Globe Interface: Interactive globe for selecting countries, powered by COBE.
Chart Displays: Line, bar, and other charts for visualizing data trends with Chart.js.
Data Filters: UI for selecting years and metrics like GDP or population.
Responsive Layout: Tailwind CSS-based design for desktop and mobile.
#Pricing 💸
Globe Graph operates on a Free model:
Free Access: All features, including visualizations and source code, are free under the MIT license.
No premium version or paid features are currently available.
#Integrations 🧰
Next.js: Core framework for server-side rendering and routing.
Tailwind CSS: Utility-first styling for responsive design.
Chart.js: Library for rendering data charts.
COBE: 5kB WebGL library for 3D globe visualization.
TypeScript: Ensures type-safe development.
Vercel: Deployment platform for hosting.
#Conclusion:
Globe Graph is a compelling tool for visualizing country data, blending interactive charts with a stunning 3D globe. Its modern tech stack (Next.js, TypeScript, COBE) and open-source nature make it ideal for developers and educators, though its focus on specific metrics and potential performance issues on low-end devices are limitations. Globe Graph is a great choice for data visualization projects.
Frequently Asked Questions
What is Globe Graph, and what data does it show?
Globe Graph is a free, open-source web app for visualizing country data like GDP, GDP per capita, and population using charts and a 3D globe.
Is Globe Graph free to use?
Yes, it’s fully free under the MIT license.
How do I set up Globe Graph?
Clone the repository (git clone https://github.com/Virous77/GlobeGraph.git), install dependencies with pnpm or yarn, and deploy on Vercel or use Docker.
GlobeGraph
Visualises countries' data like GDP, population,etc. using charts.
Resource Types:
UI Kits :
Shadcn UITechnology Stack :


Have a product?
Submit your Shadcn product to AllShadcn, get featured, and drive genuine traffic while showcasing your work to the world. Turn your creativity into revenue and begin selling today! 🚀